
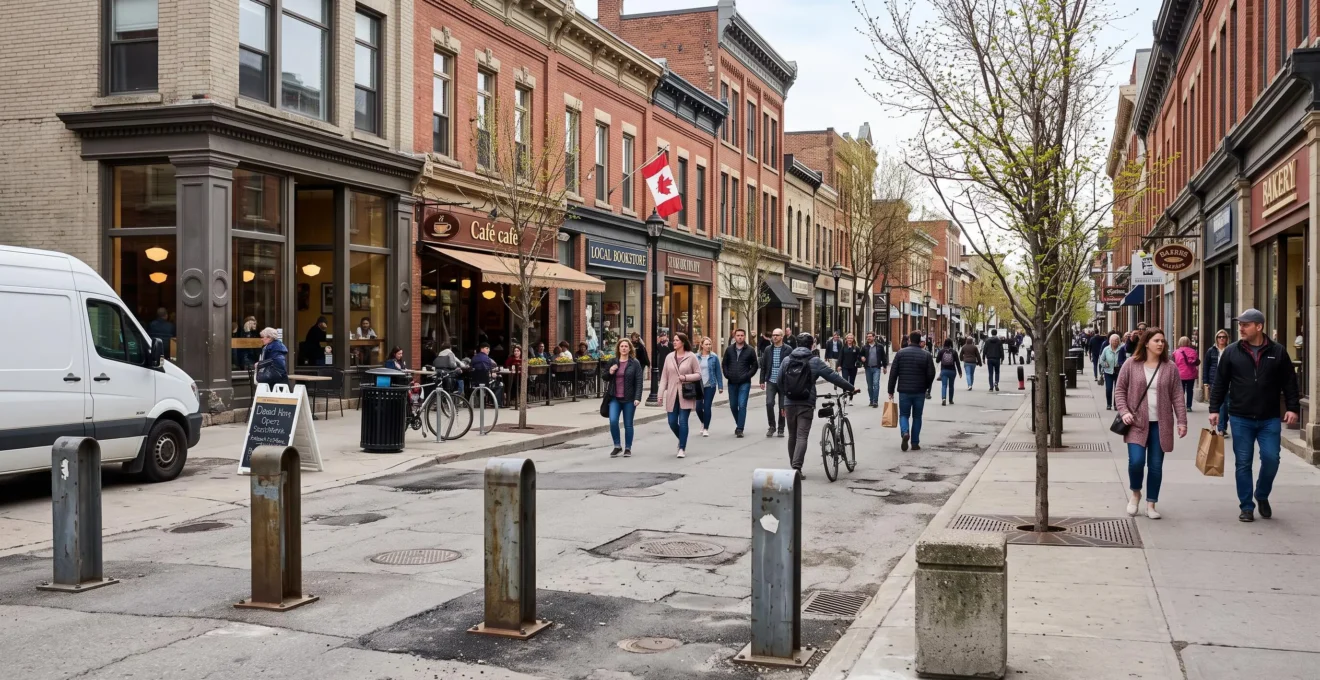
Closing a street to vehicular traffic can attract more visitors, encourage longer strolls, and make outdoor patios more welcoming. However, an increase in foot traffic does not guarantee higher revenues for every merchant. A bakery might thrive on new passersby, while an adjacent hardware store loses customers unable to transport bulky items by car.
In Canada, the success of a pedestrianization initiative depends as much on the existing customer base as it does on physical design: delivery access, paratransit, perimeter parking, snow removal, and established commuting habits. The alarming claim that one in five businesses closes following a poorly planned pedestrianization is not supported by documented data. It highlights a potential risk, but should not be cited as an established statistic.
For a business owner or local resident, the relevant question is not simply whether a pedestrian street attracts crowds. It is essential to identify who uses the street, who actually makes purchases, which trips become more difficult, and how outcomes evolve across multiple seasons.
Commercial Pedestrianization: Key Considerations
- More foot traffic does not equal higher sales. The business mix and actual spending matter far more than visible street activity.
- Projects must be evaluated across multiple seasons. The Canadian climate, travel habits, and varied commercial profiles significantly affect outcomes.
- Deliveries and accessibility are critical. An appealing street that is difficult to reach risks alienating a substantial portion of its core clientele.
- Why do some pedestrian streets thrive while others empty out after 3 months?
- How do you measure the impact of a pedestrian zone using 4 straightforward indicators?
- Seasonal vs. permanent pedestrianization: Which is most realistic in a Canadian winter?
- The fatal misstep: Pedestrianizing without a freight delivery and universal accessibility plan
- When should you launch a pedestrian street to avoid failure in the first week?
- Why does your entertainment and transit budget jump 25% when you live downtown?
- How do you verify if a bike lane is truly protected or just painted on the asphalt?
- Montreal vs. Toronto: Where does your monthly budget stretch thinnest with a $2,800 CAD rent?
Why do some pedestrian streets thrive while others empty out after 3 months?
Certain pedestrian streets maintain long-term vitality because they cater to pre-existing local demand: walkable retail, dining, daily services, and a solid surrounding residential population. Others experience a strong opening surge followed by a steep drop in attendance. However, three months is insufficient to declare a project a failure: seasonal shifts, programming, and evolving customer habits all influence foot traffic over time.
The core distinction lies between event-driven pedestrianization and structural pedestrianization. The former temporarily attracts crowds through summer terraces, pop-up markets, or street festivals. The latter aims to fundamentally transform daily mobility and public space usage. A successful permanent project must remain functional and appealing long after the events end.
The retail mix heavily dictates performance. Restaurants, cafés, and impulse-driven retail can benefit significantly from an enhanced pedestrian environment. Conversely, destination businesses whose customers rely on vehicles to transport heavy or bulky purchases often face severe challenges if curbside loading options disappear.
Data from Montreal illustrates this nuance, without proving that street redesign is the sole causal factor.
55.6%
Proportion of on-street respondents who reported, during a 2021 summer survey across 12 pedestrianized commercial streets in Montreal, that pedestrianization encouraged them to spend more. This represents self-reported intent, not audited commercial sales growth.
City of Montreal survey on 12 pedestrianized commercial streets.
This same survey found that on-street respondents who visited or planned to visit a business during their trip accounted for 77.2 %. The average reported spend was $54.13 CAD. While these figures provide insight into visitor sentiment, they do not establish an overarching increase in net business profitability.
Comparing Prince Arthur Street in Montreal with Sparks Street in Ottawa offers useful insights: centrality, daily residential use, tourism reliance, and neighborhood connectivity differ substantially. Calgary’s 17th Avenue similarly provides context on the role of a busy commercial corridor within a broader transit network, without functioning as a direct pedestrian mall equivalent.
Surrounding residential density is particularly critical. Residents who can visit frequently provide year-round baseline patronage outside festival seasons, though density alone does not guarantee commercial success in every scenario.
Disappointing attendance after three months warrants an investigation into underlying causes rather than a hasty conclusion. Trends become far more meaningful when evaluated using robust economic metrics across comparable timeframes.
How do you measure the impact of a pedestrian zone using 4 straightforward indicators?
To accurately measure the impact of a pedestrianization project, track four primary indicators: pedestrian volume, average transaction value, retail occupancy, and travel or delivery times. Compare these metrics before and after implementation across identical seasonal periods. This methodology prevents confusing a crowded sidewalk with a genuinely thriving local economy.
A business improvement area (BIA) can lead this monitoring effort without deploying complex infrastructure. The priority is maintaining consistent methodologies, observation points, and time windows.
The four complementary indicators include:
- Pedestrian counts: Record foot traffic at fixed locations during matching hours, distinguishing between weekdays and weekends. A manual tally counter is sufficient for initial tracking.
- Average transaction value: Calculate gross sales divided by the total number of transactions, based on sales data voluntarily shared by participating merchants.
- Commercial occupancy: Track active, vacant, and newly leased commercial spaces, noting tenant turnover and business category shifts.
- Travel and logistics times: Measure representative travel times between homes, storefronts, parking facilities, transit stops, and freight delivery bays.
Pedestrian volume alone does not prove new customer demand. Foot traffic may simply have diverted from a parallel corridor to the detriment of neighboring retailers. Whenever feasible, count pedestrian flows on adjacent streets as well.
To control for Canadian seasonal variations, compare identical calendar weeks year over year. Isolate external disruptions such as street festivals, utility roadwork, severe weather events, or altered business operating hours.
Commercial lease turnover requires careful analysis. A rise in vacancies may signal operational stress, but must be assessed alongside commercial rent hikes, retirements, broader economic trends, and natural business transitions.
Data tracking is most effective when sales figures are aggregated and kept confidential. A merchants’ association can publish overall percentage trends without exposing individual store performance.
The resulting insights allow municipalities to adjust course. Rising footfall paired with falling sales volumes often points to compromised accessibility, shifts in visitor demographics, or logistics hurdles for specific retail categories.
Seasonal vs. permanent pedestrianization: Which is most realistic in a Canadian winter?
Seasonal pedestrianization is frequently a sensible approach when a city wishes to test new public space uses without permanently altering traffic networks. A permanent model can succeed on streets with steady, year-round pedestrian volume, provided accessibility, freight logistics, and winter maintenance are engineered into the design. The choice should depend on proven daily usage rather than purely aesthetic goals.
In Montreal, both models exist in parallel. The City of Montreal’s official overview of pedestrian streets differentiates between year-round pedestrian zones and seasonal summer street closures. It also highlights shared streets (woonerfs), where pedestrians, cyclists, and low-speed motor vehicles share space.
Each model involves distinct operational considerations:
| Criterion | Seasonal Model | Permanent Model |
|---|---|---|
| Initial capital investment | Reversible furnishings, with recurring deployment and storage costs | Higher capital infrastructure investment, depending on civil works |
| Commuter habits | Travel patterns shift twice a year with seasonal openings and closures | Consistent layout that encourages long-term transit and walking routines |
| Winter operations | Returns to standard vehicular traffic and conventional snow plowing | Demands dedicated pedestrian snow removal, salting, and clearance paths |
| Vehicle-dependent retail | Vehicle access and loading zones are restored during winter months | Requires permanent dedicated loading bays and drop-off zones nearby |
| Project evaluation | Provides an experimental phase to pilot ideas before permanent rebuilds | Allows assessment of economic and mobility patterns across all four seasons |
Winter conditions serve as the ultimate litmus test. A year-round pedestrian street must remain safe and accessible through heavy snowfalls, freezing rain, and freeze-thaw cycles. This requires clear municipal maintenance protocols, machinery designed for bollards and street furniture, and strict clearance response times.
Individuals using mobility devices, families with strollers, and seniors are disproportionately impacted by windrows and uncleared snow piles at crosswalks and store entrances.
Conversely, seasonal pedestrianization has drawbacks: when street configurations change semi-annually, long-term walking and cycling habits can be more difficult to establish.
A corridor surrounded by dense residential housing, schools, everyday services, and high-frequency transit provides a strong case for permanent conversion. A street characterized by large-format shopping or destination automobile trips is often better suited to a temporary, reversible pilot.
The most viable framework is one that guarantees accessible, economically sound function throughout the entire year. A bustling terrace in July does not guarantee a functional commercial street in January.
The fatal misstep: Pedestrianizing without a freight delivery and universal accessibility plan
A pedestrian street implemented without clear freight delivery logistics and universal accessibility planning risks driving away long-standing customers and compromising business operations. Merchants require reliable freight access to replenish inventory, while individuals with limited mobility must be able to reach local services. These functional necessities do not vanish when vehicle traffic is restricted; they require coordinated, field-tested solutions.
A business may experience higher sidewalk foot traffic while simultaneously struggling with basic supply chains. If delivery drivers cannot park within a workable distance, deliveries become slower, more costly, and operationally complex.
Delivery congestion often spills over into adjacent residential streets, resulting in double-parking, blocked driveways, pedestrian conflicts, and truck idling at nearby intersections.
Mont-Royal Avenue in Montreal provides a concrete example of operational management. For its summer 2026 pedestrianization, municipal authorities scheduled street cleaning, waste collection, and commercial deliveries between 7:00 a.m. and 11:00 a.m. Specialized paratransit vehicles continued serving the corridor via perpendicular side streets, accompanied by tailored local transit shuttles for individuals with functional limitations.
These measures are detailed in the operational guidelines for the pedestrianization of Avenue du Mont-Royal, representing a locally tailored logistics framework rather than a universal standard across Canada.
Universal accessibility is also governed by statutory requirements. In Ontario, Ontario Regulation 191/11 (Integrated Accessibility Standards) mandates, for designated exterior paths of travel, a minimum clear width of 1,500 mm (subject to limited exceptions), alongside strict standards for cross-slopes, surface stability, and obstacle-free clearance.
This requirement is not a uniform standard across all Canadian provinces. Its legal application depends on the nature of the project and the governing public or private entity. Municipalities in other provinces must review their respective provincial building codes and accessibility legislation.
Logistics Checklist Before Restricting Street Traffic
- Survey every business regarding freight volume, vehicle sizes, and delivery time windows. Deliverable: A comprehensive logistics profile for each commercial block.
- Map dedicated perimeter loading zones and carrier access routes. Deliverable: A spatial plan showing designated loading bays and backup curbside spaces.
- Audit pedestrian paths alongside individuals with varying mobility limitations. Deliverable: A geolocated audit of physical barriers, grade transitions, and required remedies.
- Verify dedicated access for taxis, paratransit, and short-term drop-off zones. Deliverable: A signage and wayfinding plan for passenger pick-up and drop-off points.
- Engage commercial freight carriers and municipal service departments well before launch. Deliverable: A signed operational protocol detailing monitoring roles and adjustment processes.
A street that is attractive to stroll along but impossible to supply or reach fails a fundamental urban test. Design must accommodate residents and customers who rely on vehicles or specialized transit.
When should you launch a pedestrian street to avoid failure in the first week?
Late spring is often an advantageous window to debut a pedestrian street in Canada: weather patterns improve, and businesses can capitalize on patio season. However, this timing is not universally applicable. A smooth rollout depends above all on the completion of construction works, fully established access routes, and proactive customer communications.
Launching a pedestrian zone amidst active civil construction forces visitors through detours and dust, producing an immediate negative impression. Furthermore, announcing a street closure on short notice disrupts regular shoppers who find access cut off without clear alternatives.
A phased rollout mitigates these early disruptions:
- Begin with a temporary weekend closure to stress-test detour routes, parking behavior, and signage.
- Expand to a multi-month summer program while collecting consistent baseline data on foot traffic and retail spending.
- Pilot cold-weather operations if the municipality is contemplating permanent, year-round pedestrianization.
- Determine long-term infrastructure investments based on documented empirical data, verified challenges, and practical mitigations.
Clear decision benchmarks must be established beforehand: maintaining core freight access, monitoring retail sales trends, ensuring pedestrian corridor safety, tracking user satisfaction, and confirming the city’s operational capacity for street cleaning and snow clearance.
Public communications require careful coordination. Retailers must be equipped to explain to their customers how to reach their shops, where to pick up online orders or heavy items, and which perimeter parking facilities are available. Commercial freight carriers need updated loading instructions several weeks in advance.
Scheduling should also avoid overlapping with major utility or infrastructure projects on surrounding streets that could sever neighborhood access. Coordinating the opening of summer patios and public spaces creates immediate street vibrancy from day one.
A high-profile grand opening can generate initial buzz, but it does not indicate sustainable long-term adoption. The initial weeks are crucial for identifying unforeseen field issues: unworkable loading zones, poorly positioned crosswalks, or insufficient short-term parking.
The first week must focus on preserving existing retail patronage and making new access routes intuitive. Broadening visitor appeal can then be built on dependable, smooth operations rather than short-lived novelty.
Why does your entertainment and transit budget jump 25% when you live downtown?
Living adjacent to a vibrant pedestrian street can increase certain dining and entertainment expenses, though a 25% budget increase is neither automatic nor supported by available data. Daily exposure to cafés, restaurants, and retail can encourage impulse purchases, whereas reducing private automobile dependency often yields substantial savings. Net household impact depends on personal spending habits and primary transportation modes.
A downtown resident’s budget experiences two opposing forces. On one hand, an active street environment provides constant opportunities for spontaneous coffees, casual dining, and retail purchases. On the other, living in a walkable neighborhood can significantly cut spending on gasoline, vehicle parking, and maintenance.
To evaluate this trade-off objectively, a household can track its actual monthly expenses before and after moving to a walkable commercial area.
| Budget Category | Before Move | After Move |
|---|---|---|
| Transit, fuel, and parking | $320 | $180 |
| Dining and entertainment | $200 | $290 |
| Discretionary impulse purchases | $60 | $100 |
| Total | $580 | $570 |
These figures are illustrative. In this hypothetical scenario, increased dining and spontaneous retail spending is offset by transportation savings. Another household with different transit habits might see the opposite result.
To verify the hypothesis of a 25% increase, calculate the difference between the post-move and pre-move budgets, divide by the initial budget, and multiply by 100. The tracking categories must remain identical across both comparison periods.
Transit passes, auto insurance, and depreciation on a retained vehicle require close scrutiny. Walking to the corner grocery store does not eliminate the fixed overhead costs of vehicle ownership if a car is kept parked in an underground garage.
Pedestrian infrastructure improves local commercial accessibility while altering consumer spending patterns. The true financial outcome must be calculated empirically rather than inferred solely from lively patio crowds.
This approach connects two sides of urban economics: the increased local sales sought by retail merchants and the disposable income of local neighborhood households.
How do you verify if a bike lane is truly protected or just painted on the asphalt?
A bicycle lane is physically protected when a structural barrier physically separates cyclists from motorized traffic along its route. A painted white line merely designates street space without providing a physical obstacle against vehicle encroachment. To evaluate a bike route, assess barrier continuity, intersection design, and winter maintenance feasibility.
This distinction directly affects commercial pedestrian zones. When customers can reach a retail district along bike routes perceived as genuinely safe, the corridor expands its customer catchment area without requiring additional parking lots.
A field audit should assess four physical criteria:
- Physical separation: Look for concrete curbs, bollards, raised grade separations, or planter barriers that physically prevent vehicular intrusion.
- Intersection safety: Examine conflict zones at right turns, commercial driveways, and crosswalks where physical protection often breaks down.
- Network continuity: Verify that the lane connects seamlessly to commercial main streets and residential neighborhoods without sudden, hazardous gaps.
- Winter maintenance: Check whether lane widths and barrier placements permit municipal sidewalk plows to clear snow effectively.
Many urban cycling routes feature a mix of protected and unprotected segments. The presence of concrete curbs for a single block does not qualify an entire corridor as a protected bikeway.
The correlation with business revenue must also be interpreted carefully. Cyclists represent an active customer base, but available sources do not prove that cyclists systematically spend more per transaction than drivers or transit riders.
Municipal capital budgets, transportation master plans, and council resolutions provide critical context. An announced cycle track may be in early design, partially funded, or deployed merely as a seasonal pilot.
For a merchant, the practical objective is understanding whether a customer can ride safely to the street, park their bicycle securely, and continue their shopping on foot.
A cycling network functions as one component of a broader urban access system, complementing public transit, wide sidewalks, and accessible parking options for drivers who require vehicle access.
Key Considerations When Choosing a Neighborhood
- Identical rent in two cities does not mean identical living costs: transportation and parking expenses can dramatically alter monthly cash flow.
- The feasibility of car-free living depends heavily on your specific neighborhood, job location, transit proximity, and family routines.
- A walkable shopping street enhances lifestyle and daily convenience, but may increase spontaneous discretionary purchases that should be budgeted for.
Montreal vs. Toronto: Where does your monthly budget stretch thinnest with a $2,800 CAD rent?
With an identical hypothetical rent of $2,800 CAD, neither Montreal nor Toronto is automatically more expensive for every household. The difference depends largely on daily commuting patterns, parking fees, vehicle ownership, and discretionary lifestyle choices. A household must calculate the total cost of living associated with two specific addresses rather than relying on citywide averages.
Neighborhood selection is just as decisive as the choice of city. An apartment located steps from a subway station, supermarkets, and primary services can enable car-free living. Conversely, a home requiring a daily vehicular commute incurs substantial operating costs, even if the monthly rent appears comparable.
In Toronto, elevated parking costs, auto insurance rates, and highway congestion can weigh heavily on car-dependent households. In Montreal, comprehensive cycling networks, high transit connectivity, and walkable commercial arteries can lower total transit spending. However, these factors do not establish a universal rule without specific property and household data.
For a rigorous comparison, evaluate the following budget lines independently:
| Evaluation Category | Montreal | Toronto |
|---|---|---|
| Baseline rent scenario | $2,800 CAD | $2,800 CAD |
| Public transit | Monthly pass fares and route frequency along your actual commute | Monthly pass fares and route frequency along your actual commute |
| Automobile ownership | Auto insurance premiums, fuel, maintenance, and vehicle necessity | Auto insurance premiums, fuel, maintenance, and vehicle necessity |
| Parking expenses | Monthly building garage fees and municipal residential street permits | Monthly building garage fees and municipal residential street permits |
| Dining and social outings | Average prices and visit frequency at local establishments | Average prices and visit frequency at local establishments |
| Local daily retail | Essential grocery and personal services accessible on foot | Essential grocery and personal services accessible on foot |
This comparative framework prevents attributing citywide cost assumptions to a specific neighborhood. Two locations within the same municipality can yield drastically different commuting and living costs.
Pedestrianization plays a role in this comparison as a facet of urban form. It can make neighborhood shops more accessible, create enjoyable walking routes, and encourage local spending. However, its practical lifestyle value always depends on direct transit integration, universal accessibility, and personal daily routines.
Before signing a residential lease, draft comprehensive monthly budgets for both target addresses, mapping daily commutes to work, grocery stores, and recreation. A $2,800 CAD monthly rent alone does not dictate which city will prove more affordable or deliver a higher quality of life.
Does pedestrianizing a street automatically increase merchant sales?
No. An increase in visitor volume expands sales opportunities, but does not translate into automatic revenue growth. Results vary based on business sector, accessibility, customer demographics, and actual purchasing patterns. The 2021 Montreal survey measured self-reported perceptions and intent, not audited commercial financial returns.
Is there evidence that pedestrianization causes 20% of businesses to fail?
Available empirical sources do not substantiate the claim that pedestrianization leads to a 20% business closure rate. Verifying such a claim would require multi-year business bankruptcy and turnover data, a defined observation window, and controlled comparisons with non-pedestrianized corridors facing identical macroeconomic headwinds.
Who is responsible for snow removal on a permanent pedestrian street?
Maintenance duties depend on municipal jurisdiction, public right-of-way classifications, and local service agreements. Prior to capital completion, plans must specify clearance responsibilities, dedicated machinery, maintenance zones, and operational response times, particularly around pedestrian crosswalks and shop entrances.
How can a merchant report delivery access issues following pedestrianization?
Merchants should document specific logistical issues, noting impacted delivery times, affected carriers, problematic street locations, and measurable financial consequences. Submitting an empirical record to the municipal transportation department or BIA facilitates targeted adjustments, such as shifting loading time windows or reconfiguring perimeter loading bays.
Can a seasonal pedestrian street become permanent?
Yes, subject to municipal approvals, urban planning bylaws, and public consultations. A seasonal pilot allows cities to evaluate user adoption, traffic impacts, pedestrian volumes, and maintenance needs before committing to permanent infrastructure. Summer results, however, must be paired with thorough assessments of winter conditions and year-round accessibility.