
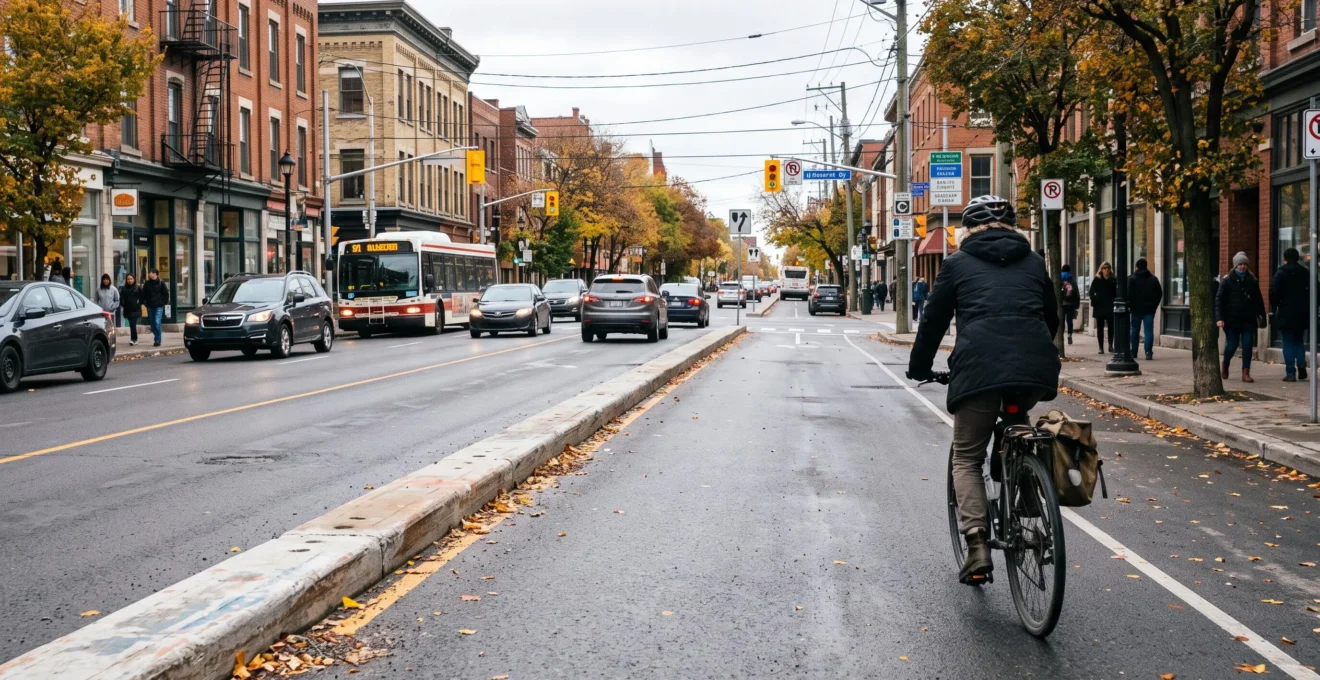
A protected bike lane can reduce hazardous conflicts between cyclists and motor vehicles, particularly on high-speed or heavy-volume commercial arterials. However, a 40% reduction in collisions is neither automatic nor proven across every Canadian street. That widely cited figure originates from a specific U.S. study examining targeted roadway configurations, rather than evaluating physically separated cycle tracks exclusively.
Evaluating an active transportation project on a Canadian arterial requires looking beyond headline percentages: barrier continuity, intersection geometry, motor vehicle volumes, freight delivery zones, universal accessibility, and winter maintenance. A well-designed protected bike lane can safeguard cyclists without gridlocking the street. Conversely, an infrastructure project that drops physical separation at intersections or is buried under plowed snow windrows merely shifts collision risks rather than resolving them.
Real-world experiences from Toronto and Montreal provide concrete benchmarks for understanding what works, what falls short, and what questions residents and business owners should ask before endorsing a municipal design.
What You Need to Know About Protected Bike Lane Safety
- The 40% figure reflects a statistical association observed on specific intersection street segments in Philadelphia, not a universal guarantee for Canadian protected lanes.
- Physical barriers significantly reduce mid-block vehicle conflicts, but intersection design remains the decisive factor in preventing severe collisions.
- An effective cycle track must integrate commercial loading zones, accessible transit boarding, pedestrian movements, and dedicated winter maintenance right from initial planning.
- Why physical protection fundamentally alters intersection collision dynamics
- How to verify whether a bike lane is genuinely “protected” or merely painted asphalt
- Protected bike lane vs. multi-use path: Which design minimizes pedestrian-cyclist conflicts?
- The oversight that derails projects: Overlooking freight loading and accessibility, then losing merchant support
- When a bike lane becomes unusable in winter: 3 maintenance decisions that make all the difference
- Why winter triggers transit delays and missed connections across public transit networks
- Walking, standard bicycle, or e-bike: Which choice is realistic for a 6 km commute?
- Why walking or cycling 20 minutes a day can trim transportation expenses by $150 CAD/month
Why physical protection fundamentally alters intersection collision dynamics
Physical barriers prevent direct vehicle encroachment along mid-block street segments where cycling and driving paths run parallel. At intersections, however, those paths inevitably cross: safety then hinges on sightlines, vehicle turning radii, dedicated signal phasing, and crosswalk treatments. A protected bike lane does not automatically eliminate collision risks at intersections.
Along an urban arterial, a raised concrete curb, bollard row, or planter wall prevents motorists from drifting into the cycling space. This physical barrier eliminates close-passing maneuvers, sideswipes, and vehicle doorings. Its safety benefit is most pronounced where speed differentials between motor traffic and bicycles are substantial.
Intersections introduce entirely different conflict points. A right-turning vehicle can turn across the path of a through-moving cyclist (a “right-hook”). Commercial driveways, mid-block alleys, and sight-blocked crosswalks can also sever physical protection.
A rigorous intersection design must address several operational factors:
- Clear reciprocal visibility between approaching cyclists and turning drivers before the conflict point.
- Set-back stop lines, forward bike boxes, and protected intersection corner islands.
- Dedicated bicycle signal heads and split signal phases that eliminate concurrent turning movements.
- Continuous route delineation and green conflict markings across the entire intersection box.
40%
Estimated reduction in the odds of injury-involved collisions associated with the presence of bicycle lanes on specific street segments featuring one- or two-way stop-controlled intersections in Philadelphia, based on 2011–2014 data. This is neither a blanket collision reduction nor a metric exclusive to physically separated cycle tracks.
Kondo et al., study published in Safety Science (2018).
This study published in Safety Science on bike lanes and collisions analyzed 37,673 street segments. The authors documented a 48% favorable association on four-way intersection segments and 43% on high-traffic corridors. However, multiple other street configurations showed no statistically significant reduction in injury collisions.
These findings are observational: they do not prove that installing a bike lane will mechanically duplicate identical collision reductions in another city. Cycling volumes, street geometry, vehicle speeds, and intersection design dictate local outcomes.
In Canada, documented municipal pilots reveal two metrics that are frequently conflated. During the Bloor Street West bike lane evaluation in Toronto, municipal monitoring documented a 44 % reduction in observed conflicts among all road users. Meanwhile, total collisions between cyclists and motor vehicles remained statistically stable while cycling ridership surged substantially.
An avoided conflict is not the same as an avoided collision. A conflict measures a near-miss or evasive braking interaction; a collision represents an actual physical crash. These two safety metrics do not always track in lockstep.
A comprehensive report from the Transportation Association of Canada (TAC) on bicycle infrastructure safety emphasizes that bikeway types and intersection treatments must be selected based on local road classification and vehicle operating speeds, rather than relying on a one-size-fits-all model.
Significant safety gains materialize only when physical barriers, intersection sightlines, and turn protections operate as a coherent system. This is why the label “protected bike lane” must always be tested against the physical reality on the street.
How to verify whether a bike lane is genuinely “protected” or merely painted asphalt
A bicycle lane is physically protected only when a structural vertical barrier separates the cycling space from motorized traffic lanes. A painted white line, green thermoplastic coating, or painted bicycle stencil provides visual demarcation, but zero physical protection against vehicle encroachment. Assessing a route requires verifying barrier continuity, usable clear width, and intersection safety treatments.
The City of Montreal official cycling network map distinguishes between physically protected cycle tracks (separated by concrete curbs or flexible bollards) and painted on-street bike lanes. It also maps designated four-season cycling corridors.
While municipal map layers are helpful, broad administrative classifications do not reveal on-the-ground gaps. A physical barrier that is frequently interrupted for commercial driveways or easily mounted by delivery vans leaves cyclists vulnerable to sudden vehicle intrusions.
Field audits should examine the entire corridor, paying close attention to transit stops, dedicated loading bays, commercial driveways, and signalized intersections. A bikeway can feature solid concrete barriers for hundreds of meters, only to drop all protection right where turning vehicles create the greatest conflict.
The comparative matrix below outlines practical field criteria for identifying true physical separation:
| Evaluation Dimension | Physically Protected Cycle Track | Painted On-Street Bike Lane |
|---|---|---|
| Physical Demarcation | Precast concrete curb, bollards, grade separation, or planters | Painted white stripe, painted buffer, or green surface coating |
| Vehicle Encroachment | Physically blocked where barrier is continuous and appropriately sized | Vehicles can easily cross, park, or idle inside the lane |
| Intersection Treatment | Requires set-back crossing geometry, corner islands, or bike signals | Requires shared mixing zones or merge lanes across vehicle turns |
| Winter Maintenance | Requires specialized narrow sidewalk/lane plowing equipment | Cleared by standard municipal road-plowing trucks |
Auditing a Proposed Bike Lane: Five Actions
- Obtain engineering design drawings: Review municipal plans detailing barrier specifications, curb heights, and intersection treatments.
- Map barrier discontinuities: Chart all commercial driveways, alleyways, and intersection drops where physical protection disappears.
- Conduct rush-hour field audits: Document delivery vehicle double-parking, illegal drop-offs, and turn conflicts during peak hours.
- Verify curbside stakeholder needs: Identify commercial loading bays, accessible paratransit zones, and pedestrian crossings along the block.
- Confirm winter maintenance protocol: Secure written municipal service standards regarding plowing priority and specialized snow equipment.
Provincial geometric design guides, municipal active transportation plans, and technical guidelines from the Transportation Association of Canada provide engineering context. Design standards vary based on provincial highway acts, municipal charter powers, and roadway classifications.
Credible physical protection must function in complex operational environments, not just on straightforward mid-block stretches. Planning must also account for pedestrians who cross or share the street space.
Protected bike lane vs. multi-use path: Which design minimizes pedestrian-cyclist conflicts?
Along busy commercial streets, a dedicated cycle track physically separated from the pedestrian sidewalk organizes travel modes far better than a narrow shared space. A shared multi-use pathway remains viable along recreational greenways or low-density suburban corridors. Design selection must balance user volumes, speed differentials, available street right-of-way, and pedestrian crossing frequency.
On a multi-use pathway, pedestrians, standard bicycles, fast e-bikes, and e-scooters share a single surface. When speed differentials are wide and pedestrian volumes are high, frequent passing maneuvers, unpredictable walking trajectories, and close passes generate friction.
A cycle track dedicated exclusively to bicycles isolates these interactions to predictable crossing locations: designated crosswalks, transit platforms, and store entrances. These contact points require clear sightlines, tactile paving, and intuitive crossing geometry.
The choice is not between a safe design and a dangerous one; it is about matching infrastructure to user volume and context:
| Street Context | Dedicated Protected Cycle Track | Shared Multi-Use Pathway |
|---|---|---|
| Busy commercial retail main street | Preserves clear pedestrian sidewalks while providing dedicated cycling space | Risks severe pedestrian-cyclist conflicts and crowded sidewalk conditions |
| Low-volume recreational park corridor | Often unnecessary capital expense if pathway traffic is light | Functions effectively where path width and sightlines accommodate passing |
| High pedestrian crossing frequency | Requires clearly marked, accessible pedestrian crosswalks across the track | Blurring modal boundaries can leave pedestrians feeling unsafe |
| Daily utilitarian transportation corridor | Supports predictable cycling speeds and long-distance commuting | Becomes congested and slow when pedestrian volumes climb |
Intermediate street designs demand careful scrutiny. Flexible plastic delineator posts provide visual guidance, but offer zero structural stopping power compared to concrete curbs. Contraflow cycle tracks require dedicated signage and sightlines so motorists pulling out of driveways look both ways for oncoming cyclists.
The Transportation Association of Canada’s report on the safety of bicycle infrastructure in Canada provides guidance for selecting facility types and intersection treatments. However, national guidelines do not prescribe a universal motor vehicle volume threshold that mandates one specific facility type in every scenario.
For local municipal projects, practical questions are decisive: What are the projected pedestrian and cycling volumes? What micro-mobility devices are permitted? Where do primary pedestrian desire lines cross the corridor? Without these operational facts, facility selection relies on generic preference rather than functional design.
An effective design must also maintain essential curbside street functions. That includes accessible transit boarding, paratransit drop-offs, and commercial freight deliveries.
The oversight that derails projects: Overlooking freight loading and accessibility, then losing merchant support
Bike lane projects face fierce neighborhood pushback when commercial freight deliveries, customer pick-ups, and accessible parking are addressed as an afterthought. Physical bike protection must not sever essential curbside operations. Designing dedicated loading bays and accessible passenger zones into the initial street plan reduces operational friction and leads to constructive public consultations.
Local businesses depend on regular commercial deliveries, often involving large trucks operating within tight delivery windows. If a new cycle track eliminates curbside loading zones without providing dedicated alternatives, delivery drivers double-park in traffic lanes, block bike paths, or unload from crosswalks, compromising street safety.
Universal accessibility is equally non-negotiable. People with mobility limitations, paratransit passengers, and seniors must be able to reach sidewalks and storefronts without navigating trip hazards or stepping directly into cycling traffic.
Street designs must incorporate floating bus boarding islands, accessible curbside drop-off zones, dedicated taxi spaces, and continuous tactile walking surfaces. Accessibility requirements are governed by provincial and municipal building codes.
Toronto: The Bloor Street West Pilot Project
Installed in August 2016, the Bloor Street West pilot underwent comprehensive municipal evaluation covering traffic safety, motor vehicle operations, retail economic impacts, and universal accessibility.
The City designed designated delivery zones, accessible curbside loading spaces, street ramps, and dedicated passenger drop-off points. The municipal evaluation documented an increase in customer spending along the corridor. However, merchant sentiment remained divided: a majority of surveyed local business owners did not support the pilot project.
The City of Toronto evaluation of the Bloor Street bike lane project illustrates a key urban reality: measurable improvements in cycling volumes or traffic conflict reductions do not automatically resolve all business stakeholder concerns.
To mitigate curbside conflicts, municipalities can deploy practical design solutions: locating dedicated loading bays within reasonable distance of commercial clusters, establishing off-peak freight delivery windows, creating shared loading spaces, and preserving barrier-free passenger zones.
These accommodations must be field-tested with the businesses and delivery drivers who use them. A loading bay that looks good on an engineering plan is useless if it is located too far away, lacks adequate turn-in clearance, or is chronically blocked by unauthorized parking.
Pilots allow communities to evaluate real-world operational data rather than relying on speculation. Evaluation scorecards should track bicycle and motor vehicle counts, observed conflict rates, transit travel times, curbside delivery compliance, and business sales data. Economic data must be evaluated within broader regional economic trends.
Stakeholder consultation must occur early enough to shape preliminary street layouts. Presenting rigid, finalized engineering drawings turns manageable technical adjustments into prolonged political conflict.
A successful street design is not one that eliminates every trade-off, but one that makes operational compromises transparent and incorporates measurable feedback. This operational realism is essential for managing winter weather.
When a bike lane becomes unusable in winter: 3 maintenance decisions that make all the difference
Three operational maintenance decisions dictate whether a protected cycle track remains viable through a Canadian winter: its priority ranking in municipal snow-clearing operations, the removal of plowed snow windrows along barrier curbs, and specialized de-icing treatments. A well-engineered cycle track that sits unplowed after a snowfall forces cyclists into mixed traffic lanes, undermining its safety benefits.
Decision 1: Assigning snow-clearing priority. When an arterial road is cleared for motor vehicles while the protected bike lane waits days for clearing, winter cycling collapses. Municipalities must define clear service-level standards, deploy specialized equipment, and establish automatic snowfall deployment triggers.
In Montreal, municipal reporting from August 2026 highlights an overall cycling network of 1,083 kilometers, including 740 kilometers designated for year-round cycling. Of this winter network, 251 kilometers feature physical separation, while 489 kilometers rely on painted lanes and street signage.
This designation establishes which routes receive winter maintenance, though it does not guarantee that every kilometer is bare pavement immediately following a storm.
Decision 2: Managing plowed snow windrows. Road plows clearing adjacent traffic lanes naturally push heavy snowbanks against concrete curbs and bollards. These windrows narrow the usable width of the bike lane, even if the center was plowed.
Bikeway geometry must accommodate specialized municipal sidewalk plows and include dedicated snow storage zones. Curb spacing, snow storage pockets, and intersection clearance protocols must be engineered prior to construction.
Decision 3: De-icing and surface treatments. A plowed asphalt surface can remain an invisible sheet of black ice. Winter maintenance protocols must use brine, salt, or fine aggregate matched to ambient temperatures and cycling pavement materials, rather than assuming standard highway salt spreads will work on narrow bike tracks.
Residents can monitor local maintenance performance by logging simple observations: snowfall end time, time of first plow pass, comparative conditions on adjacent car lanes, blocked curb drains, and usable clear width. Consistent observational logs provide far more constructive feedback to city councils than isolated photos.
Winter automated bicycle counter data provides helpful context. Ridership counts show seasonal trends, though fluctuations reflect broader winter temperature patterns alongside maintenance quality.
Four-season infrastructure must be managed as a continuous public service, rather than an amenity abandoned after the first snowfall. When bike infrastructure fails in winter, travel demand shifts directly onto public transit networks.
Why winter triggers transit delays and missed connections across public transit networks
Heavy snow, freezing rain, and traffic gridlock slow bus operations, obstruct curb access, and cause missed transfers across public transit systems. Delay on the initial leg of a bus route cascades through the schedule. When winter conditions make cycling unviable, public transit serves as an essential backup, but its winter schedule reliability must be factored in.
Transit buses share surface lanes with general traffic. When slick roads force traffic to crawl or snowplows block travel lanes, transit schedule predictability breaks down.
At bus stops, windrows left by street plows block curb access, forcing buses to load passengers from the travel lane. Navigating snowbanks slows passenger boarding, particularly for seniors and parents with strollers. Small delays at successive stops quickly compound into significant schedule deviations.
This is especially disruptive for multi-leg transit trips. If a feeder bus arrives five minutes late, missing a connecting bus that runs only every 30 minutes doubles total commuting time.
The connection to protected bike lanes is indirect but significant: a cleared, well-maintained cycling network enables cyclists to maintain active commutes through winter. When bike lanes sit unplowed, those commuters shift to buses and subways.
However, you cannot assume this seasonal shift automatically causes severe transit overcrowding. Actual ridership impacts depend on route capacity, service frequency, and weather severity.
To manage winter commuting volatility, riders can:
- Identify corridor bottlenecks that regularly experience winter gridlock.
- Monitor real-time transit vehicle GPS tracking apps before leaving home.
- Build an extra schedule buffer into multi-leg trips requiring tight transfers.
- Identify alternative walking or direct transit routes for blizzard days.
Adding a transfer buffer does not solve a severely delayed initial bus leg. Leaving earlier remains the most reliable strategy when winter schedules break down.
Choosing between cycling, transit, and walking requires weighing schedule reliability alongside nominal travel time. This comparison becomes practical when evaluating a 6 km daily commute.
Walking, standard bicycle, or e-bike: Which choice is realistic for a 6 km commute?
For a 6 km daily commute, a standard bicycle or e-bike is generally far more practical than walking when travel time is limited. Route safety, physical effort, seasonal weather, and transit backup options dictate which mode works best. A continuous protected cycle track makes cycling appealing, but safe infrastructure must extend across the entire trip.
Distance alone does not determine the best commuting mode. Topography, signalized intersections, pavement quality, and winter maintenance shape the daily experience.
To establish realistic travel times, a 6 km walk takes roughly 60 to 90 minutes at a standard walking speed of 4 to 6 km/h. On a conventional bicycle, an average commuting speed of 14 to 18 km/h yields a 20-to-26-minute trip, excluding signal delays.
These figures are illustrative calculations rather than surveyed averages for a specific Canadian municipality:
| Transportation Mode | Primary Advantage | Key Operational Consideration |
|---|---|---|
| Walking | Zero equipment capital cost; weather resilient | Requires 60 to 90 minutes each way daily |
| Standard Bicycle | Predictable travel time; integrated daily exercise | Physical exertion, route safety, and winter gear |
| Electric Bicycle (E-bike) | Flattens hills; eliminates heavy perspiration | Higher purchase price, charging, and secure bike parking |
| Public Transit | Sheltered travel during severe winter weather | Transit frequency, transfer delays, and walking to stops |
An e-bike eases the transition from private vehicle commuting to active transportation. Electric pedal-assist flattens steep hills and carries cargo easily, but does not eliminate intersection conflict risks or icy winter road hazards.
Infrastructure quality dictates whether an active commute is viable. Riding 6 km on a protected cycle track or quiet residential street feels entirely different from cycling 6 km on a busy commercial arterial with no physical separation.
Compare real, door-to-door routes rather than straight-line map distances. A slightly longer route along a quiet greenway or protected bike lane is often far safer and less stressful than the shortest route along a congested arterial.
Having a dependable transit or rideshare backup for blizzard days or mechanical breakdowns makes year-round active commuting sustainable.
Replacing motor vehicle trips with active transportation also lowers monthly household spending. However, financial savings must be calculated using verified displaced expenses.
Key Considerations When Calculating Commuting Savings
- Financial savings depend entirely on the specific transportation mode being replaced, not just the kilometers pedaled.
- Fixed auto ownership overhead—insurance, registration, depreciation—persists if a car remains parked in your driveway.
- A continuous, protected, and winter-maintained route provides the safety needed to sustain active commuting year-round.
Why walking or cycling 20 minutes a day can trim transportation expenses by $150 CAD/month
Walking or cycling for daily errands reduces household transportation costs when active trips replace paid vehicle or transit travel. Saving $150 CAD per month is an achievable planning scenario, not a universal guarantee. Realized savings depend on parking rates, fuel consumption, transit pass structures, trip frequency, and bicycle maintenance costs.
A rigorous calculation separates variable savings from fixed overhead that persists. Replacing short vehicle trips reduces gasoline consumption, eliminates hourly parking meters, and slows mileage depreciation. However, retaining an insured vehicle in your driveway means insurance premiums and annual registration costs continue.
Replacing public transit involves different financial math. A commuter who buys single transit tickets saves money with every ride replaced by cycling. However, if they maintain an unlimited monthly transit pass, cycling occasionally yields zero financial savings unless the monthly pass is canceled entirely.
An illustrative model shows how $150 CAD in monthly savings develops: eliminating $7.50 CAD in variable driving expenses (fuel and paid parking) across 20 workdays produces $150 CAD in gross monthly savings. This is an illustrative model rather than an official Canadian driving cost benchmark.
Deduct the operating expenses of cycling: tune-ups, tire replacements, lights, locks, and initial bicycle depreciation. For an e-bike, factor in battery charging and future battery pack replacement costs.
To calculate your personal savings, track the specific expenses eliminated for every replaced car or transit trip. Multiply that figure by your monthly riding days and subtract cycling upkeep for an accurate personal estimate, rather than relying on a generic $150 CAD target.
The primary barrier to sustained financial savings is broken infrastructure. If a critical segment of your route lacks physical protection, if bike lanes are blocked by delivery vans, or if snow maintenance fails in winter, commuters naturally return to driving or transit.
A protected bike lane functions as enabling infrastructure that unlocks personal financial savings. However, available empirical data does not establish an average household financial return across all Canadian communities.
To evaluate a proposed municipal bike project, request detailed intersection drawings, winter maintenance plans, and performance monitoring frameworks from your city council. These public documents provide an objective baseline for discussing traffic safety, curbside commerce, and the real-world performance of your street.
Does a protected bike lane guarantee a 40% drop in collisions?
No. The 40% figure represents an observational statistical association identified on specific stop-controlled street segments in Philadelphia. The study evaluated on-street bicycle lanes and does not demonstrate that installing physical barriers automatically reduces total collisions by 40% in every Canadian city. Realized safety outcomes depend heavily on intersection geometry, vehicle speeds, and traffic volumes.
What is the difference between a traffic conflict and a traffic collision?
A conflict is an observable interaction where road users take sudden evasive action (such as emergency braking or swerving) to avoid a crash. A collision is an actual physical impact between road users. During the Bloor Street West evaluation in Toronto, observed user conflicts dropped by 44%, while reported vehicle-cyclist collisions remained stable as cycling volumes increased. These two safety metrics should not be treated as identical.
Is a bike lane separated only by flexible plastic bollards truly protected?
Flexible plastic posts provide visual delineation and discourage casual vehicle encroachment, unlike simple painted lines. However, they provide zero physical impact protection against an errant motor vehicle. Intersections, commercial driveway crossings, and gaps between bollards must be evaluated on their own engineering merits.
Can a protected cycle track remain open and operational year-round?
Yes, provided its width accommodates specialized sidewalk snowplows and the municipality deploys dedicated winter clearing, windrow removal, and anti-icing treatments. Montreal maintains a designated four-season cycling network. However, designated status does not guarantee bare pavement immediately after every blizzard.
What public documents should you request before supporting a proposed bike lane?
Request detailed intersection engineering drawings, traffic volume studies, dedicated curbside freight loading plans, universal accessibility reviews, winter maintenance service standards, and the post-installation monitoring framework. These records allow residents and merchants to evaluate real-world street operations rather than conceptual renderings.